In the app Times Tables you can visualise beautiful patterns by using a simple formular. Here I’ll illustrate the technique – how to draw the times tables:


Step by step – drawing Times Tables
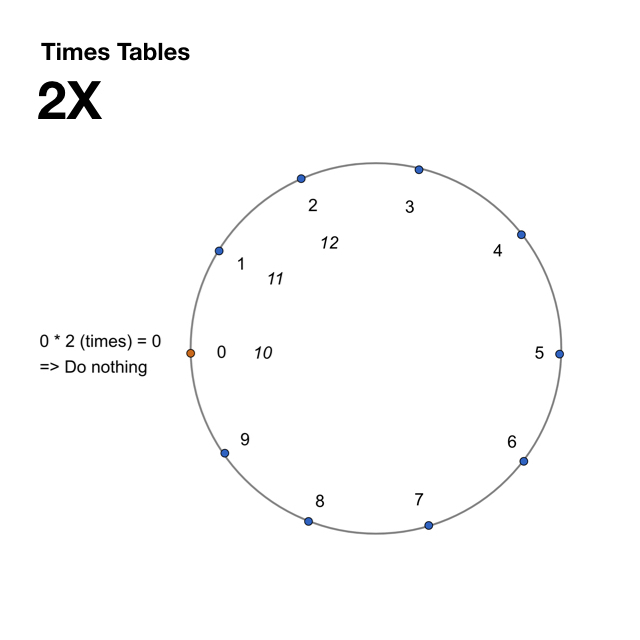
This is the starting figure. I have divided the circle into 10 segments and indicated a running index that continues into infinity. I’ll make the times tables for 2X.
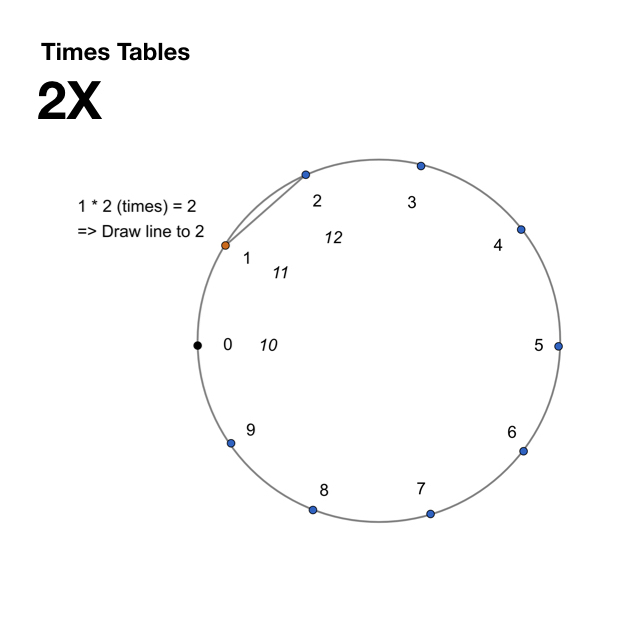
This is how the coordinates of the first line is calculated.
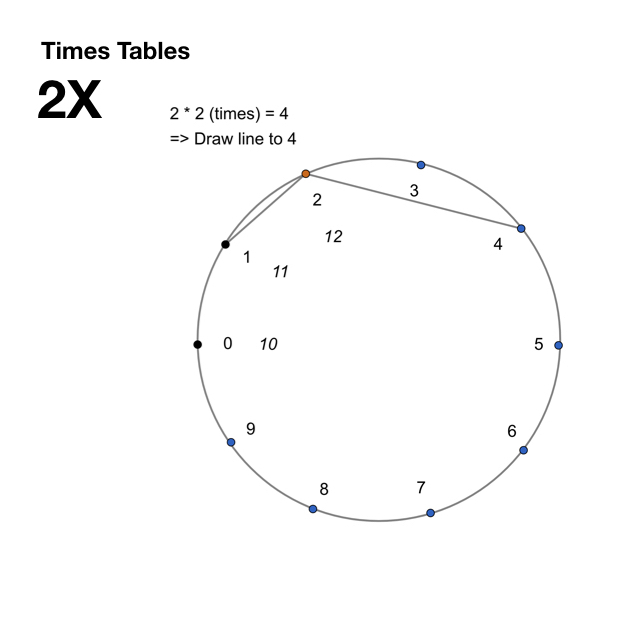
This is the second line. Keep going from point to point – multiply with 2 and find the point that match.